
Randomized controlled trials (RCTs) are considered the “gold standard” in clinical medicine. Perhaps for this reason, health authorities all over the world have assumed the universal validity of RCTs and have not recognized that RCT results may not be valid everywhere or for the epidemiology of infectious diseases. Using the Pfizer-BioNTech vaccine trial as a case study, we illustrate the limitations of the RCT and show that the results may be inappropriate for COVID-19 epidemiology. This critique explains why health authorities have not recognized that the vaccines have failed to stem the growth of the COVID-19 pandemic. This insight has also broader implications for the global pharmaceutical industry.
Introduction
In December 2020, the US Food and Drug Administration (FDA) announced [1] emergency use authorization (EUA) of the Pfizer-BioNTech vaccine for approved use to prevent COVID-19 infections in America. The EUA approval was based a vaccine trial which reported “95% effectiveness” in preventing COVID-19 infection. Governments all over the world rushed to place orders for supplies, based on the assumed relevance and effectiveness of the vaccine for their own countries. For example, without conducting its own trials, Israel struck an early deal with Pfizer to get preferential supplies.
Few countries, if any, conducted independent RCTs to verify that the Pfizer-BioNTech results were valid for their own populations. For example, the Therapeutic Goods Administration (TGA) in Australia performed no independent clinical, chemical or biological verification of the application submitted in November 2020 by Pfizer Australia Pty Ltd (the sponsor). The TGA approved [2] registration within about two months on January 24, 2021 based on documentation. The decision rested entirely on “clinical (pharmacology, safety and efficacy) and risk management plan information submitted by the sponsor”.
The rush to approve and order supplies was based on a common misunderstanding that the RCT results from clinical experiments may be validly applied to the epidemiology of all countries. This paper shows why the results of the best clinical trials may not be reliable, or relevant, or applicable to the populations of all countries, particularly during epidemics. As an example, evidence is provided for why the “95% effectiveness” is over optimistic for Australia and may not apply accurately to its epidemiology.
Randomized double-blind placebo-controlled trials (RDBPCTs) or randomized controlled trials (RCTs) for short are often called the “gold standard” [3,4] in clinical medicine to test hypotheses, particularly in relation to testing the efficacy of treatments and interventions. Put simply, RCT is regarded as one of the best prospective methods to overcome known biases for testing relationships between medical treatments and outcomes. The RCT evidence favoring a treatment is not obtained retrospectively from already known treatment outcomes. The EUA approval by the FDA [5] of the BNT162b2 mRNA COVID-19 vaccine was based on the results of a prospective Pfizer-BioNTech RCT (PBRCT), which serves as an important case study of the method.
Pfizer-BioNTech RCT
A total of 43,548 participants were enlisted [6] from about 153 medical institutions, mainly hospitals, health centres or research clinics in Argentina, Brazil, but mostly in the US. The participants, meeting certain criteria, were randomly selected and divided approximately equally by numbers into a vaccine group taking the BNT162b2 vaccine and a placebo group. The selection was randomized and “double blind” so that the researcher is agnostic to who is in which group and the participants are agnostic to which group they belong. The populations studied in each group are controlled so that they each represent the US adult population to the same degree of accuracy. The controls are mainly to ensure nearly the same demographic distributions for age, gender and ethnicity.
The two groups which, though are never strictly identical, are considered “identical”, if their distributions of relevant factors are sufficiently close to identical. For example, if gender is considered a relevant factor, then the two groups must have the same numbers or the same proportions of males and females. A trial is said to be “placebo controlled”, when the impacts of all relevant factors on the experimental outcomes are equalized between the treatment group and the placebo group.
The results of the Pfizer-BioNTech RCT [6] are condensed and summarized in Table 1.
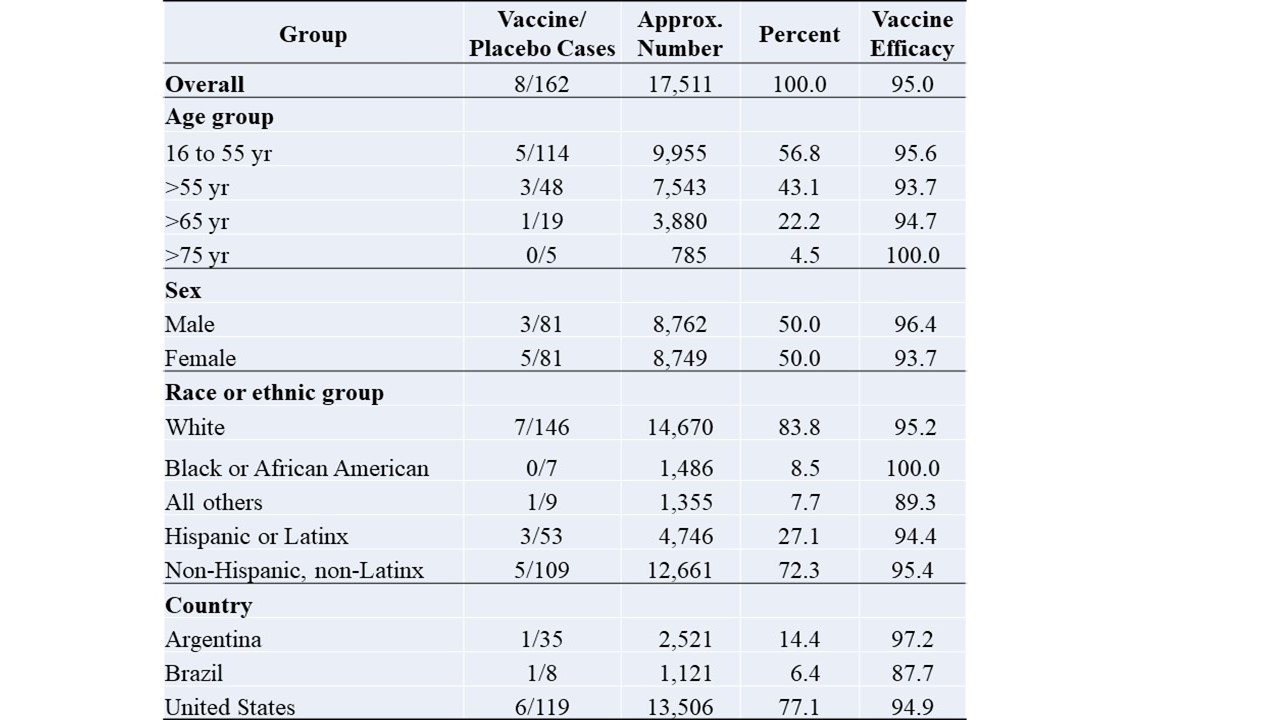 Table 1. Pfizer-BioNTech vaccine trial results summary
The second column shows the numbers of symptomatic infection cases among the vaccinated group compared to the placebo group. The third column shows the approximate numbers of participants in each group or sub-group, where the total numbers for vaccine or placebo populations are approximately the same (17,511 shown only for the placebo population). The next column shows in percentages the distribution of various factors: age, sex, race or ethnicity and country. The last column is the vaccine efficacy for each group or subgroup, which is defined by the relative risk reduction (RRR) calculated by one minus the ratio of vaccine/placebo cases (in the second column), expressed as a percentage.
The headline result of this PBRCT is that the Pfizer-BioNTech vaccine is “95% effective” overall. Virtually the world over, the “95% effective” result was taken to be universally valid, like a law of physics. This is far from the truth. The truth is: in mid-2020, given a set of selection criteria (to be discussed) of participants and given age, gender and ethnicity distributions given in Table 1, the RCT resulted in the vaccine group having only about one infection for every twenty infections in the placebo group or a RRR of 95%. In practical terms, the RCT result means that for a “typical” American adult picked at random, Pfizer-BioNTech vaccine reduces the risk of infection to 5% of the risk without the vaccine.
It is important to note that a prospective, unbiased and precise result was obtained for a very specific set of conditions of the PBRCT. For this reason, the result has no universal validity, because those specific conditions essentially define the limitations of the PBRCT, which was not globally representative. Results of RCTs are typically not general, because generality has been traded-off for experimental accuracy.
Limitations of PBRCT
Limitations of RCT have been discussed broadly in the literature [7-10]. Here, the main type of limitation for the PBRCT case study relates more specifically to population-based health interventions [10] because measured vaccine efficacy of PBRCT depends significantly on the health status of the underlying population. A sick placebo population would benefit more from intervention, while a healthy one would benefit less. This difference leads to a higher measured vaccine efficacy for a sick placebo population relative to a healthy one. Therefore, the placebo population of the PBRCT needs to be compared with the target population to which the Pfizer-BioNTech vaccine is intended to apply.
The PBRCT results are generally invalid if the target population has significantly different distributions in age, gender, or ethnicity. For example, the PBRCT result would not apply to a population with significant percentages of children under 16 years or to a country with a younger population like Kenya, where the median age is 21.1 years compared with the US median age of 38.8 years. Also, the PBRCT did not include many ethnicities such as Eskimos in the Arctic or Mongolians in Asia or Masai in central Africa, which is important because different ethnicities may react differently to the vaccine, giving different measured values of efficacy.
In common with other medical RCTs, the PBRCT only controlled the distributions of selected variables viz. age, gender, and selected ethnicity. Safety can only be observed, not controlled, over short-term trials. There are potentially many other variables, known or unknown, which were not controlled or uncontrollable, leading to potentially unintended bias in the results. For example, both human and physical geography affect population health which may explain why a medical treatment which is efficacious in New York City, may not be as efficacious in Los Angeles.
Geographic Impact
There is an extensive research literature which shows geography can have a significant impact on the prevalence and development of respiratory diseases, including Influenza and COVID-19.
To examine geographic impact on COVID-19, a data source has been downloaded from Our World in Data (OWID) [11] for all countries on November 5, 2021, to construct a 139-country dataset using the filtering criteria that the country must have a population exceeding two million. The geographic variable is the absolute latitude, ignoring hemispheric difference, with the data downloaded from Maps of World [12]. The relationship between total COVID cases in 2020 and absolute latitude is shown in Figure 1.
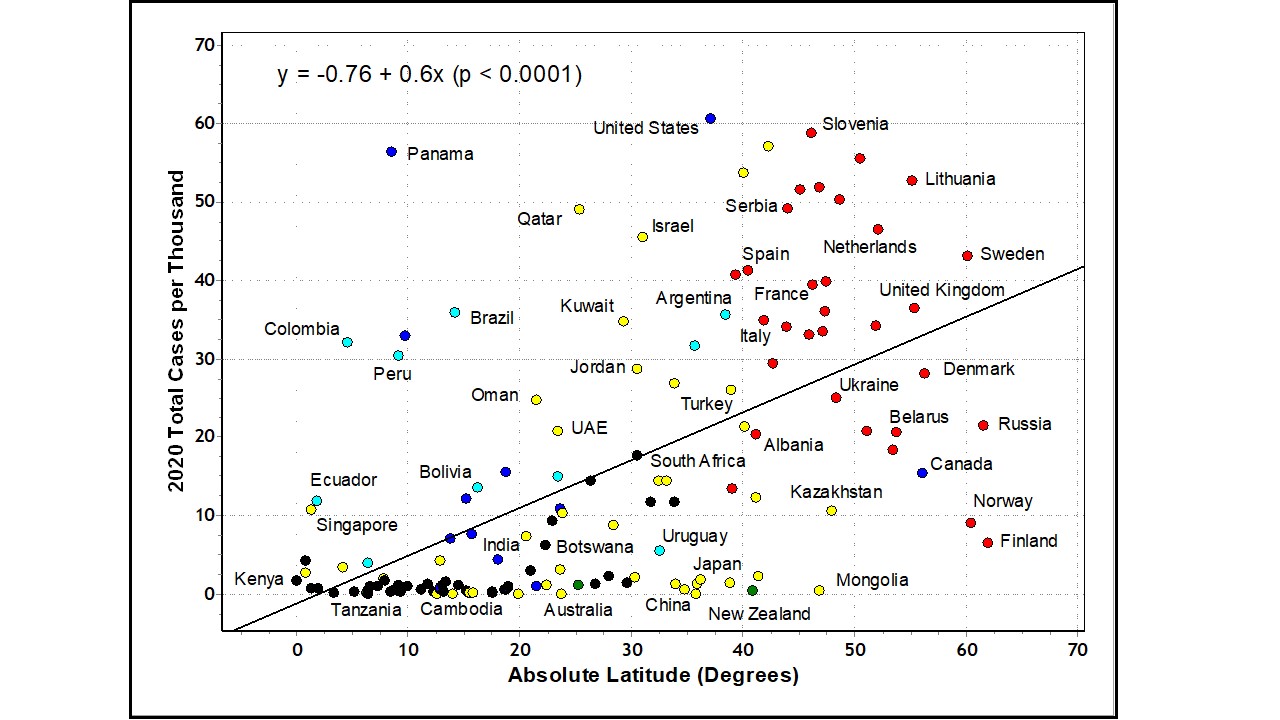 Figure 1. Total COVID cases in 2020 versus absolute latitude.
Evidently, higher latitudes have had generally more serious COVID-19 epidemics. The relationship for 139 countries is statistically significant with a correlation coefficient of 52%. A linear regression analysis gives an equation (shown above) which has an R-square of 0.266, F statistics of 33.4 and p-value < 0.0001. The t-values of the intercept and regression coefficient are respectively 0.39 and 5.78. This highly significant statistical relationship has well-known causal explanations suggested in the literature from which we mention two effects for why latitude has such a strong effect on COVID-19.
Firstly, numerous studies [13-16] have indicated the influence of latitude, temperature, and humidity on air-borne transmission of respiratory diseases, including coronaviruses. Hot and humid climates in lower latitudes tend to reduce the survival time of air-borne respiratory viruses compared with cold and dry climates in higher latitudes. Therefore, higher latitude countries such as those in Europe and North America (to the right of Figure 1) have climatic conditions which could be more susceptible to the transmission of COVID-19 disease.
Secondly, latitude, ultraviolet B radiation, vitamin D, respiratory and other immune diseases have clear causal relationships which are not always easy to establish individually and empirically [17-19] due to multiple confounding factors such as age, skin colour, body mass index, lifestyle, sun exposure, vitamin supplementation and health status. Nevertheless, the relationship between latitude and COVID-19 epidemic (in Figure 1) has likely a vitamin D causal component [19]. For example, 41.6% of US adults have vitamin D deficiency, with serum 25-hydroxyvitamin D less than 50 nmol/L [20], while traditionally living East Africans have mean serum 25-hydroxyvitamin D of 115 nmol/L [21].
Nordic countries being cognizant of the relationship between latitude and vitamin D levels have public policies of vitamin D supplementation [22] in staple foods such as milk, yogurt, and butter. Due to confounding factors mentioned, the impact of supplementation is not always predictable with certainty. For example, in Figure 1, the benefit of supplementation may be suggested by mild epidemics in Norway and Finland which have strong and widespread vitamin D supplementation [22]. However, despite similar supplementation, Sweden did not benefit epidemiologically, performing in line with most European countries, perhaps because Swedish supplementation was ineffective since vitamin D deficiency was still found [22, 23] in nursing home residents.
In summary, geographic dependence implies that a respiratory disease (say the Omicron variant of SARS-CoV-2) may appear mild in South Africa, but more severe in Germany. The levels of epidemic disease may not be universal and therefore, the medical response and treatment should depend on disease severity at given geographic locations. Countries near the horizontal zero baseline in Figure 1 may not benefit at all from vaccines. The PBRCT vaccine efficacy is measured relative to a target population (the placebo group), which depends significantly on geography.
That is, the measured vaccine efficacy of PBRCT depends on where the experiment was conducted. The much touted “95% effective” result applies only to the American population located in the United States. Commonly-assumed vaccine efficacy from PBRCT may not be valid for other countries. For example, the assumption is unwarranted for Australia without the Therapeutic Goods Administration (TGA) undertaking further independent clinical verification, because the US population is not a suitable benchmark for Australia.
US population benchmark
Without independent verification, how well might the PBRCT vaccine efficacy result apply to other countries? That is, how good does the US population serve as a proxy benchmark for the population of other countries, for the purposes of RCTs? These questions are relevant for far more than RCTs of COVID vaccines because many drugs and medical treatments used globally have been based, often solely, on results from US RCTs. Analysis of the validity of PBRCT could have far-reaching global pharmacological implications.
For the purposes of comparison, from Figure 1, G20 countries (19 excluding the Eurozone member) are ranked per severity of COVID-19 epidemics in 2020, before significant vaccination took place. This comparison shown in Table 2, serves as an indication of population health and its vulnerability to diseases.
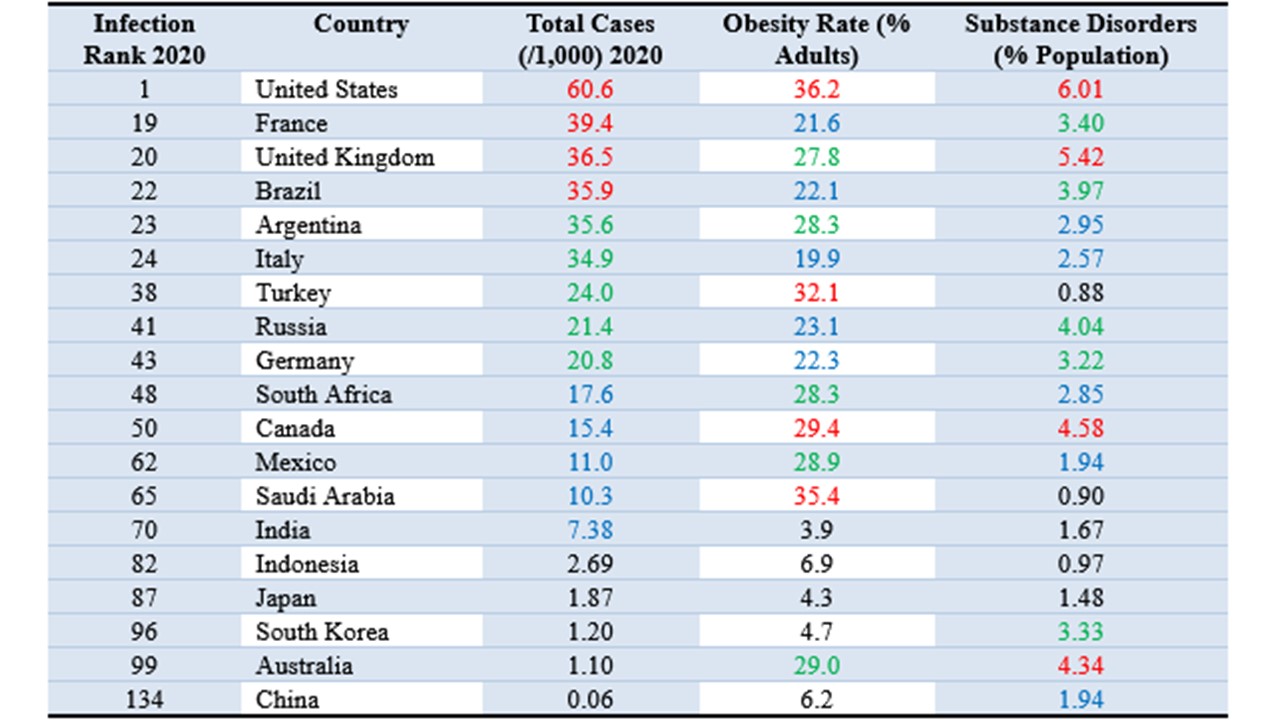 Table 2. G20 comparison of population health on selected metrics
The first column is the infection severity ranking of COVID-19 epidemic, with United States ranking first, being worst affected out of 139 countries. The third column shows that throughout 2020, the worst country had six percent of the population infected. The numbers in that column and subsequent columns are colour coded: red for top quartile, green for second, blue for third and black for bottom quartile.
The next two columns provide a couple of potential explanations, not directly related to geography, for why United States may be most vulnerable to disease. Data from World Population Review [24] show that among the G20 countries, United States has the highest number, with over 36% adults, suffering from obesity (Body Mass Index greater than 30). Obesity is recognized as a comorbidity which increases vulnerability to the COVID-19 disease. It is understood to be related to diet and lifestyle, which are cultural factors.
The US culture also includes a prevalence of substance abuse disorders [25], which is dominated by illicit drug use (e.g., opioids, cocaine, amphetamines, and cannabis), but also includes alcohol addiction. Among G20 countries, the US has median life expectancy (78.8 years), but the second highest number (after Turkey) of years (more than 11) living with disabilities [26]. On several metrics, the US population is probably the unhealthiest country among G20, which includes most of the world’s populations.
It is possible that the population of participants in the PBRCT is even less healthy than the average US population, because all clinical trials have a potential bias of selecting participants who use medical facilities such as hospitals and are more likely to be diseased compared to the rest of the population. Healthy individuals are less likely to be in the catchment of participants for clinical trials.
For these reasons, the US population of clinical trials probably sets the lowest benchmark for testing medical treatments. That is, testing a medical treatment among a sick population would inflate its efficacy compared with testing among a healthy population. As a hypothetical but relevant example, taking the 2020 data as a guide, if the PBRCT were conducted in Australia, then instead of 162 infection cases as in the US placebo group (see Table 1), there may only be three cases in Australia, because Americans were 60 times more likely than Australians to get COVID-19 in 2020. If the Australian vaccine group remained at eight cases of infection, then relative risk reduction (RRR) would be negative at -167%. Even if there were only one case in the Australian vaccine group, the RRR would only be 67%, which is substantially lower than the “95% effective” claim from US data.
Even in the US, the risk of COVID infections was very low at about 5.5% pa in the PBRCT and 6% realized for 2020, leading to problems of statistical significance in the measurement of relative risk reduction of vaccines, due to differences of small numbers. The problems of accuracy and statistical significance are exacerbated for lower risk countries such as Australia. It becomes virtually meaningless to consider vaccine efficacy when a population has zero or near zero risk of infection, as has been the case for children in most countries.
Epidemiological limitation
Population health due to demographics and geology limits the general applicability of the results of PBRCT to other countries, which are essentially spatial limitations of RCT validity. This limitation has important implications for worldwide sales of pharmaceutical products tested in the US. However, there is also a significant temporal limitation to the validity of PBRCT results to epidemiology, which is a dynamic phenomenon.
The PBRCT started on July 27, 2020, during the early US phase of the COVID-19 epidemic and the experiment lasted eight to ten weeks. The participant selection criteria excluded persons who had previous COVID infections and only included symptomatic infections in the outcomes. As indicated [27], the measure of vaccine efficacy or effectiveness relevant for epidemiology should be based on real-world data comparing infection rates between vaccinated and unvaccinated populations, as this information drives health policy decisions.
The PBRCT measured vaccine efficacy was based on clinical data collected over a short period. It is not relevant in a developing epidemic, because the underlying population on which data are collected for assessment may be changing in medically significant ways. Vaccine efficacy in an epidemic is expected to change dynamically determined by real-world data. The real-world data include substantial asymptomatic cases detected by the PCR and other diagnostic tests [28].
Importantly, as epidemics progress, an increasing proportion of the population becomes infected, with many recovering and acquiring infection-induced natural immunity [29,30]. Naturally-acquired immunity which may be more effective than vaccine-induced immunity [31], will ultimately lead to sufficient herd immunity to end further infection and end the epidemic, which may then become endemic. Historically, humanity has never been seriously threatened by the natural development of past epidemics. Effective vaccines may initially help reduce infection, but measured vaccine efficacy will likely decline relative to a population with greater natural immunity and fewer infections. Also, at a certain stage, vaccines may become irrelevant and may even be counter-productive if immune escape occurs [32].
Evidently, measured from real-world data during the COVID pandemic, vaccine efficacy for any country has rarely, if ever, matched or come close to, that predicted by PBRCT. For example, instead of vaccines reducing risk of infection by 95%, they have increased risk of infection by more than 100% among major age groups in the UK [27]. Using the PBRCT as a case study, this paper has isolated some reasons for why RCT results are generally not valid for epidemiological application in any country. The issues raised are summarized in Table 3.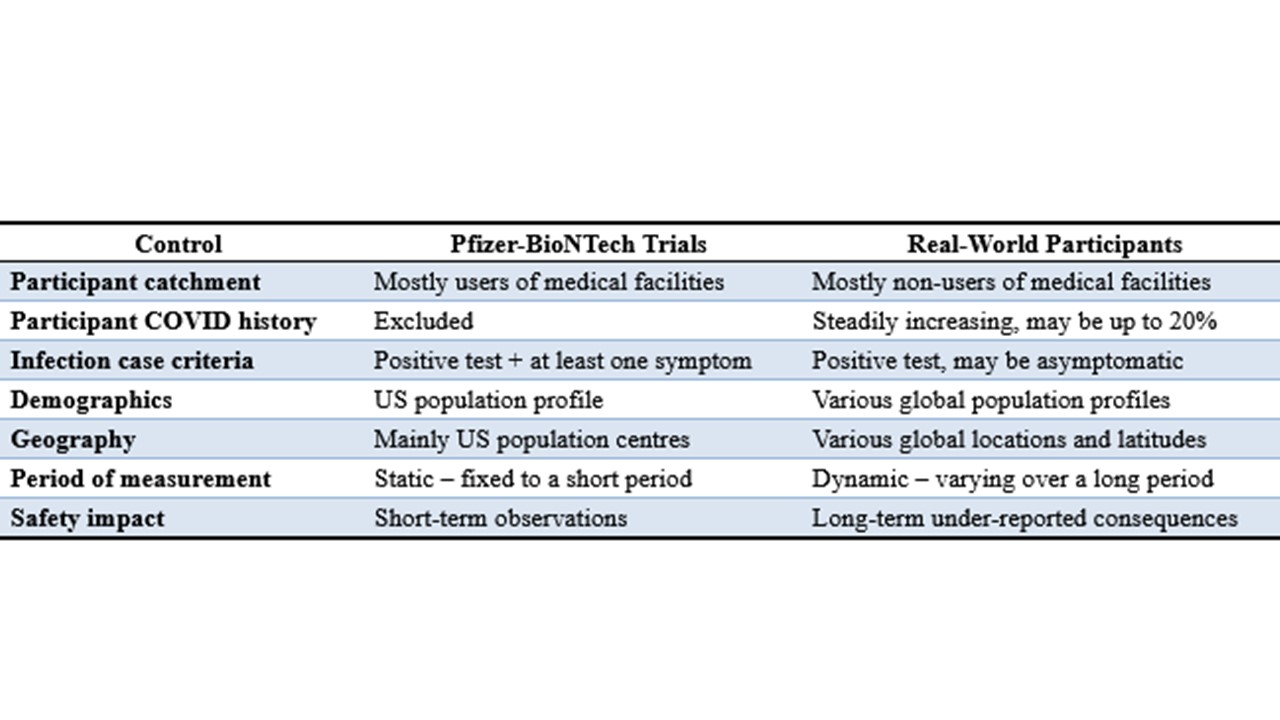 Table 3. Pfizer-BioNTech vaccine trial participants versus real-world participants
Health authorities everywhere have been slow to recognize that real-world data have resoundingly falsified the vaccine efficacy measured in randomized control trials. Perhaps their cognitive dissonance originates from a misunderstanding of the limitations of RCT which has been held as a “gold standard” method, not challengeable by other methods or by real-world data. In true science, one method can never be definitive and override all other methods, because all methods have their own strengths and weaknesses. Any important universal truth must be verified by as many different methods as possible.
Conclusion
This paper has illustrated a widespread misunderstanding of randomized control trials, which have intrinsic limitations due to unavoidable biases in the selection of their populations of participants. Proving effectiveness or efficacy of any medical treatment is dependent on participants, who would not be selected if they have zero risk of the target disease. For example, healthy young children or certain traditional living Africans may have zero risk of COVID infections, disqualifying them for the purposes of proving vaccine efficacy.
The flaws in method extend to many pharmaceutical products, including COVID vaccines, which have been tested with US populations. Effectiveness proven through the “gold standard” of clinical medicine in the US has been misconstrued as universally valid, as evident by the early rush to order COVID vaccines by health authorities everywhere in the COVID pandemic. Generally, US results may exaggerate efficacy for other locations because the US population of trial participants may be one of the unhealthiest in the world. As epidemics progress, herd immunity increases, leading to a population with increasing resistance to infection and with vaccine effectiveness declining to redundancy.
References
-
US Food and Drug Administration. FDA takes key action in fight against COVID-19 by issuing emergency use authorization for first COVID-19 vaccine, FDA News Release, December 11, 2020. Retrieved from: https://www.fda.gov/news-events/press-announcements/fda-takes-key-action-fight-against-covid-19-issuing-emergency-use-authorization-first-covid-19 (accessed Jan 7, 2022).
-
Therapeutic Goods Administration. COMIRNATY: Australian prescription medicine decision process, Australian Government Department of Health. Retrieved from: https://www.tga.gov.au/apm-summary/comirnaty (accessed Feb 5, 2022).
-
Hariton E, Locascio JJ. Randomized controlled trials—the gold standard for effectiveness research, BJOG. 2018 December, 125(13): 1716, Retrieved from: https://www.ncbi.nlm.nih.gov/labs/pmc/articles/PMC6235704/pdf/nihms966617.pdf (accessed Jan 7, 2022).
-
Pocock SJ, Elbourne DR. Randomized trials or observational tribulations? New England Journal of Medicine, June 22, 2000, Vol. 342, 1907-9. Retrieved from: https://edisciplinas.usp.br/pluginfile.php/5124329/mod_folder/content/0/CR%C3%8DTICA/pocock_nejm_2000.pdf (accessed Feb 7, 2022).
-
US Food and Drug Administration. Pfizer-BioNTech COVID-19 vaccine, FDA Briefing Document: Vaccines and Related Biological Products Advisory Committee Meeting, December 10, 2020. Retrieved from: https://www.fda.gov/media/144245/download (accessed Jan 7, 2022).
-
Polack FP, Thomas SJ et al. Safety and efficacy of BNT162b2 mRNA Covid-19 vaccine, The New England Journal of Medicine, December 16, 2020, Vol. 383, No.27. Retrieved from: https://www.nejm.org/doi/pdf/10.1056/NEJMoa2034577?articleTools=true (accessed Dec 16, 2021).
-
Kabisch M, Ruckes C, Seibert-Grafe M et al. Randomized controlled trials, Deutsches Ärzteblatt International 2011, Vol. 108, No. 39, 663–8. Retrieved from: https://www.ncbi.nlm.nih.gov/labs/pmc/articles/PMC3196997/pdf/Dtsch_Arztebl_Int-108-0663.pdf (accessed Jan 7, 2022).
-
Clay RA. More than one way to measure, American Psychological Association, September 2010, Vol. 41, No. 8, 52. Retrieved from: https://www.apa.org/monitor/2010/09/trials (accessed Feb 7, 2022).
-
Mulder R, Singh AB, Hamilton A et al. The limitations of using randomised controlled trials as a basis for developing treatment guidelines, Evidence-Based Mental Health, Feb 2018, Vol. 21, No.1, 4-6. Retrieved from: https://ebmh.bmj.com/content/21/1/4.long (accessed Feb 7, 2022).
-
Sanson-Fisher RW, Bonevski B, Green LW et al. Limitations of the randomized controlled trial in evaluating population-based health interventions, American Journal of Preventive Medicine, August 2007, 33, No.2, Pages 155-161. Retrieved from: https://www.sciencedirect.com/science/article/abs/pii/S0749379707002255 (accessed Feb 7, 2022).
-
Ritchie H, Mathieu E, Rodés-Guirao L et al. Coronavirus pandemic (COVID-19). 2020. Published online at org. Retrieved from: https://ourworldindata.org/coronavirus (accessed Nov 5, 2021).
-
Maps of World, World map with latitude and longitude. Published online at com. Last Updated on: October 5th, 2021. Retrieved from: https://www.mapsofworld.com/world-maps/world-map-with-latitude-and-longitude.html (accessed Nov 5, 2021).
-
Lowen AC, Mubareka S, Steel J, Palese P (2007) Influenza virus transmission is dependent on relative humidity and temperature. PLoS Pathogens 3(10): e151. Retrieved from: https://www.ncbi.nlm.nih.gov/labs/pmc/articles/PMC2034399/pdf/ppat.0030151.pdf (accessed Feb 12, 2022).
-
Chan KH, Malik Peiris JS, Lam SY et al. The effects of temperature and relative humidity on the viability of the SARS coronavirus, Advances in Virology, Vol. 2011, Article ID 734690, 7 pages. Retrieved from: https://downloads.hindawi.com/journals/av/2011/734690.pdf (accessed Feb 12, 2022).
-
Mecenas P, Bastos RTdRM, Vallinoto ACR, et al. Effects of temperature and humidity on the spread of COVID-19: A systematic review. September 18, 2020 PLoS ONE 15(9): e0238339. Retrieved from: https://www.ncbi.nlm.nih.gov/labs/pmc/articles/PMC7500589/pdf/pone.0238339.pdf (accessed Feb 12, 2022).
-
Sajadi MM, Habibzadeh P, Vintzileos A et al. Temperature, humidity, and latitude analysis to estimate potential spread and seasonality of coronavirus disease 2019 (COVID-19) JAMA Network Open. 2020, Vol. 3, No.6: e2011834 Retrieved from: https://jamanetwork.com/journals/jamanetworkopen/fullarticle/2767010 (accessed Feb 12, 2022).
-
Leary PF, Zamfirova I, Au J et al. Effect of latitude on vitamin D levels, Journal of Osteopathic Medicine, July 2017, Vol. 117, No. 7, 433-439. Retrieved from: https://www.degruyter.com/document/doi/10.7556/jaoa.2017.089/html (accessed Feb 12, 2022).
-
Kimlin MG, Olds WJ, Moore MR. Location and vitamin D synthesis: Is the hypothesis validated
by geophysical data? Journal of Photochemistry and Photobiology B: Biology 86 (2007) 234–239. Retrieved from: https://pubmed.ncbi.nlm.nih.gov/17142054/ (accessed Feb 12, 2022).
-
Ghelani D, Alesi S, Mousa A. Vitamin D and COVID-19: an overview of recent evidence. International Journal of Molecular Sciences, 2021, 22, 10559. Retrieved from: https://www.ncbi.nlm.nih.gov/labs/pmc/articles/PMC8509048/pdf/ijms-22-10559.pdf (accessed Feb 12, 2022).
-
Luxwolda MF, Kuipers RS, Kema IP et al. Traditionally living populations in East Africa have a mean serum 25-hydroxyvitamin D concentration of 115 nmol/l, British Journal of Nutrition 2012 Nov 14, Vol. 108 No. 9, 1557-61. Retrieved from: https://pubmed.ncbi.nlm.nih.gov/22264449/ (accessed Feb 22, 2022).
-
Forrest KY, Stuhldreher WL. Prevalence and correlates of vitamin D deficiency in US adults. Nutrition Research. 2011 Jan, Vol. 31 No. 1, 48-54. Retrieved from: https://pubmed.ncbi.nlm.nih.gov/21310306/ (accessed Feb 22, 2022).
-
Itkonen ST, Andersen R, Björk AK et al. Vitamin D status and current policies to achieve adequate vitamin D intake in the Nordic countries, Scandinavian J Public Health 2021 Aug, Vol. 49 No. 6: 616-627. Retrieved from: https://journals.sagepub.com/doi/10.1177/1403494819896878?url_ver=Z39.88-2003&rfr_id=ori%3Arid%3Acrossref.org&rfr_dat=cr_pub++0pubmed& (accessed Feb 12, 2022).
-
Arnljots R, Thorn J, Elm M, et al. Vitamin D deficiency was common among nursing home residents and associated with dementia: a cross sectional study of 545 Swedish nursing home residents, BioMed Central Geriatrics (2017) 17:229. Retrieved from: https://bmcgeriatr.biomedcentral.com/track/pdf/10.1186/s12877-017-0622-1.pdf (accessed Feb 12, 2022).
-
World Population Review. Obesity rates by country 2022, Published online at com. Retrieved from: https://worldpopulationreview.com/country-rankings/obesity-rates-by-country (accessed Feb 12, 2022).
-
Ritchie H, Mathieu E, Rodés-Guirao L et al. Drug use. Published online at org. Retrieved from: https://ourworldindata.org/drug-use (accessed Feb 18, 2022).
-
Ritchie H, Mathieu E, Rodés-Guirao L et al. Life Expectancy. Published online at org. Retrieved from: https://ourworldindata.org/life-expectancy (accessed Feb 18, 2022).
-
Sy W. Measure of vaccine efficacy relevant for COVID-19 epidemiology in UK. Retrieved from:https://principia-scientific.com/measure-of-vaccine-efficacy-relevant-for-covid-19-epidemiology-in-uk/ (accessed Feb 20, 2022).
-
Ma Q, Liu J et al. Global percentage of asymptomatic SARS-CoV-2 infections among the tested population and individuals with confirmed COVID-19 diagnosis: a systematic review and meta-analysis, JAMA Network Open, December 14, 2021, Vol. 4, No. 12, e2137257. Retrieved from: https://jamanetwork.com/journals/jamanetworkopen/fullarticle/2787098?utm_source=silverchair&utm_medium=email&utm_campaign=article_alert-jamanetworkopen&utm_content=wklyforyou&utm_term=121521 (accessed Dec 23, 2021).
-
Jones JM, Stone M et al. Estimated US infection- and vaccine-induced SARS-CoV-2 seroprevalence based on blood donations, July 2020-May 2021, JAMA. September 2, 2021; Vol. 326, No. 14:1400-1409. Retrieved from: https://jamanetwork.com/journals/jama/fullarticle/2784013 (accessed Dec 24, 2021).
-
Centers for Disease Control and Prevention (U.S.). Science brief: SARS-CoV-2 infection-induced and vaccine-induced immunity, Updated October 29, 2021. Retrieved from: https://www.cdc.gov/coronavirus/2019-ncov/science/science-briefs/vaccine-induced-immunity.html (accessed Dec 24, 2021).
-
Gazit S, Shlezinger R et al. Comparing SARS-CoV-2 natural immunity to vaccine-induced immunity: reinfections versus breakthrough infections, medRxiv. August 25, 2021. Retrieved from: https://www.medrxiv.org/content/10.1101/2021.08.24.21262415v1.full.pdf (accessed Dec 27, 2021).
-
Harvey WT, Carabelli AM, Jackson B et al. SARS-CoV-2 variants, spike mutations and immune escape, Nature Reviews Microbiology, 2021 June 1: 1-18. Retrieved from: https://www.ncbi.nlm.nih.gov/labs/pmc/articles/PMC8167834/pdf/41579_2021_Article_573.pdf (accessed Dec 12, 2021).