
The global financial crisis (GFC) has been in temporary recess since its break in 2008, but has recently metastasized into a more dangerous form. Extreme real-time experiments are being forced on many economies without sufficient scientific justification. The extreme measures, apart from constant fiscal stimulus, now including negative interest rates and banning or restricting the use of cash, have been designed and implemented, in Europe, Japan and elsewhere, to prevent saving and force spending, and also to protect a flawed financial system. The slow recovery from the GFC has been blamed on insufficient consumer spending.
As a past US Secretary of the Treasury and now a Harvard professor, Summers (2011), has said and has repeated on several occasions:
…the central irony of financial crises is that they’re caused by too much borrowing, too much confidence and too much spending and they’re solved by more confidence, more borrowing and more spending.
Apart from Summers, Yellen (2014), Stiglitz (2015), Sen (2015), many others and the media generally have been united in voicing the need for more consumer spending to boost economic growth.
Indeed, there have been decades of economic stimulation in America consisting of: generally falling official interest rates since 1980 from 19 percent to near zero now; and increasing government budget deficit spending from post-war zero balances, on average, to over 10 percent of gross domestic product (GDP) in 2009. Cognitive dissonance has been blind to the fact that US consumer spending has been very responsive to economic stimulation, as private consumption and total consumption both rose in secular trends since the Second World War (WW2).
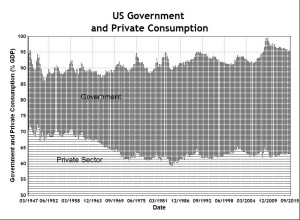
Personal consumption expenditure rose from about 59 percent of GDP to 69 percent (see the chart below), while total consumption, including government consumption, consumption of fixed capital and consumption of net imports, rose from about 86 percent of GDP to 96 percent. Therefore, the key unrecognized empirical fact is that there has never been insufficient consumer spending, as economic stimulation has been effective in boosting it, according to the evidence provided below.
Welfare Consumption
Despite periods of recession and rising unemployment, personal consumption rose smoothly and steadily giving rise to the Deaton Paradox (Campbell and Deaton, 1989), which mainstream neoclassical economists sought to explain through consumer behaviour. But personal consumption data reflect substantial government intervention in providing unemployment benefits and other social security payments, particularly in times of economic downturns. The chart below provides an indication of how personal consumption has been affected by government transfer payments.
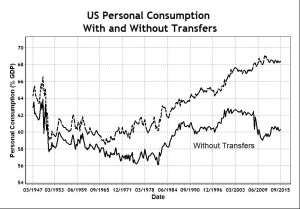
The gap between the two curves represents the amount of government transfer payments which appears directly in personal income measured by the Bureau of Economic Analysis (BEA, 2016). As these transfer payments are mostly unemployment benefits, social welfare supplements to low income earners, payments to veterans, etc., it would be reasonable to assume here that the payments would go mainly to personal consumption, which is now boosted by about eight percent of GDP. Without the boost from government transfer payments, personal consumption would be much lower and much more volatile.
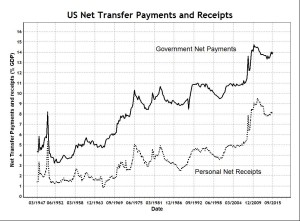
Even this boost to personal consumption by government transfer payments is likely to be an under-estimate, because consumption on health, education, insurance, etc., has not been included fully. When a sick person goes to hospital and gets medical attention, the cost is fully or partly covered by government insurance such as Medicare or Medicaid. This is another form of subsidy to personal consumption by another source of government transfer payments. The chart below shows that, potentially, the government boost to personal consumption could be nearly double the eight percent shown the above chart, now about 14 percent of GDP.
In summary, a significant amount (up to 20 percent) of personal consumption has been welfare consumption provided by government transfer payments, to increase successfully the overall propensity to consume of the economy. In order to anticipate and project the economic consequences of future fiscal policy, it would be helpful to analyze separately the impact of fiscal stimulus on consumption and investment in two sectors.
Sector Decomposition
The foregoing analysis of personal consumption in the US economy is complicated by government transfer payments, which are responsible for a significant part of measured personal consumption. To analyze the impact of fiscal policy, it is necessary to decompose the national accounting identity into two separate sectors, one for the government and one for the private sector.
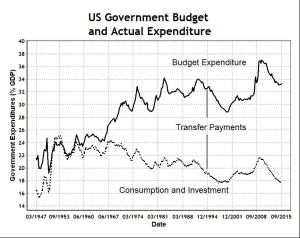
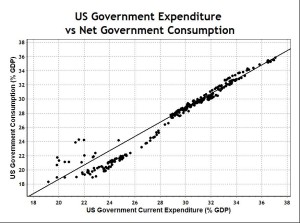
Government current expenditure including transfer payments differs from normal expenditure as seen in the chart below. Most studies on the impact of government spending on consumption refer only to normal expenditure of the government, ignoring welfare transfers. The lower curve represents normal government expenditure on consumption and investment in the national accounts.
When transfer payments are included in net government consumption, the chart below shows the government sector’s structure of aggregate demand, which consists overwhelmingly of consumption and only a small amount of net investment.
Note that this new sector decomposition essentially reallocates welfare consumption as part of government consumption, rather than as part of personal consumption because, otherwise, the impact of government stimulus on total consumption cannot be accurately evaluated. With this decomposition, the components of total consumption due to the government and private sectors are shown in the chart below.
Instead of personal consumption increasing in the private sector, it has been welfare consumption increasing in the government sector. Much of the welfare consumption has been financed through pension and social security contributions, health insurance contributions and government budget deficits. The various contributions give workers a sense of having saved through the government and a sense of future welfare entitlement. The government budget deficits lead to trillions of dollars of outstanding government bonds which form a large part of private sector saving.
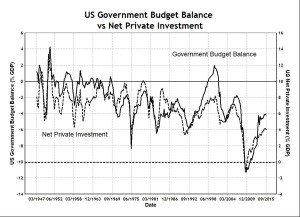
The chart below shows that government budget deficits have led to the private sector substituting real investment in economic production with financial investment by purchasing new supplies of government bonds. Note that this explanation for reduced private investment is based on substitution, different from the “crowding out” of aggregate demand argument that borrowing to spend is inhibited by high interest rates, which are clearly not the issue in the current zero interest rate environment. Sticking to the erroneous “crowding out” argument is leading to a widespread belief that interest rates are not low enough to induce more private spending – negative interest rates have been implemented recently in Europe and Japan.
In passing, Sy (2015.6) noted that the only period of US budget surplus in recent decades was in the second term of the Clinton presidency at the end of the 1990s, when the economy grew strongly and steadily at four percent per annum, unemployment fell to record lows, and government debt fell in real terms, despite rising interest rates. In a period of policy which now would be called “austerity”, the era of Clintonomics has been recognized often as the “Great Moderation”.
The impact on aggregate demand by changes in fiscal policy, whether it is through changes in taxation or budget deficits, has been a topic of debate in classical and neoclassical economic literature. The classical view expressed as Ricardian equivalence states that it makes no difference (Barro, 1989), which is evidently true for aggregate demand; but it is untrue for the structure of aggregate demand, as shown here. Decades of research on how personal behaviour changes consumption in reaction to changes in fiscal policy, have now become somewhat academic, since the government itself contributes directly to personal consumption expenditure through transfer payments to low income earners for social welfare. This will be further clarified below.
Monetary Socialism
With a significant level of socialism in the US economy, many classical questions of free-market capitalism have become confused and inappropriate. The methodological individualism of neoclassical economics, in attempting to deduce macroeconomic outcomes from the behaviour of the representative agent, has become increasingly irrelevant. No amount of modelling of individual behaviour can deduce or replicate the behaviour of government in its impact on the macroeconomy.
Irrespective of whether and in whatever circumstances Ricardian equivalence is valid or not, the US government has chosen to socialize the economy through increasing budget deficits rather than increasing taxation, as the gap between budget expenditure and receipts is shown in the chart below.
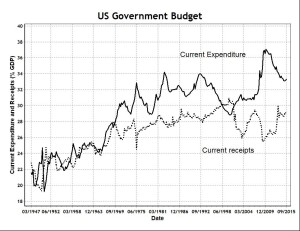
It can be seen that taxation, as represented by government current receipts, has stabilized at around 28 percent of GDP (with a two percent fluctuation) since abandonment of the gold standard in 1971. In a fiat currency system, US government expenditure has expanded through increasing budget deficits by issuing government bonds and increasing public debt.
It seems rather obvious that it is much harder politically to increase taxation than it is to increase the budget deficit, regardless of whether individuals can see or care about future financial impact on their welfare. In any case, raising taxes has typically encouraged more tax avoidance and minimization, particularly by corporations. Hence, US socialism has not been expanding directly through confiscation of private capital, but rather indirectly through monetary expansion in a modern form of monetary socialism.
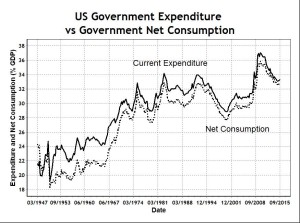
The empirical data show that monetary socialism increases consumption, as it is meant to do. The direct impact of government budget deficits on government consumption, which includes a significant component of personal consumption through welfare spending, can be seen in the chart below.
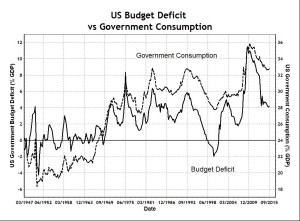
The chart suggests that government expenditure is almost entirely government consumption, particularly since 1970, because any expansion through increases in the budget deficit has translated almost directly to increases in government consumption.
When government consumption (including welfare consumption) is added to the other parts of personal consumption, the increases in total consumption of the economy can be seen to be driven by increases in government budget deficits in the chart below.
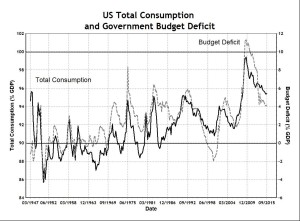 The lower horizon line represents balanced government budget (right hand axis). It can be seen that, apart from the Clinton hiatus of the late 1990s, fiscal stimulus has been conducted since 1971 through running government budget deficits. The top horizon line represents the condition for the Keynesian singularity, where the propensity to consume is unity or the Keynes multiplier is infinite, since

It can be seen that fiscal deficits have been almost completely successful in stimulating total consumption. The increases and decreases in the budget deficit translate almost wholly, “dollar for dollar”, to changes in total consumption. This close correlation can be seen in another way in the chart below.
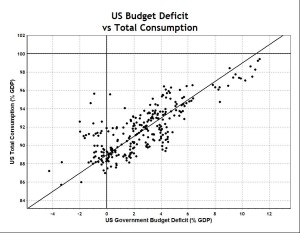
Again the horizontal line represents the condition for the Keynesian singularity. The vertical line divides government budget surpluses to left and budget deficits to the right. The diagonal line is an arbitrary 45 degrees line for reference only. A least-squares line regression gives a slightly flatter line at 37 degrees, with the slope of the regression line at 0.76. The correlation coefficient is 0.78, statistically significant with an R-square of 61.5 percent. The points in the above chart are generally moving, over time, along the diagonal line towards the Keynesian singularity, because government budget deficits have been successful in increasing the propensity to consume.
Propensities to Consume
To analyze how government spending influences total consumption and the propensity to consume (PC), it is useful to analyze separately the propensities to consume for the government and private sector. The relative significance of the two sectors to PC and net investment of the whole economy can be seen from a sector decomposition of net investment, shown in the chart below.
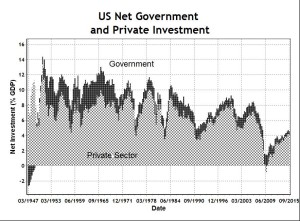
Note that over time the size of the US government has increased from 20 percent of GDP to 36 percent of GDP, but its net investment has declined from nearly four percent of GDP to less than 0.5 percent of GDP, due partly to the privatization of public assets.
It is quite clear how government spending affects total consumption in the economy: as long as the government PC is greater than the private sector PC, then government expenditure will increase the PC of the whole economy. This is most often the case in US economic history since WW2, as the chart shows.
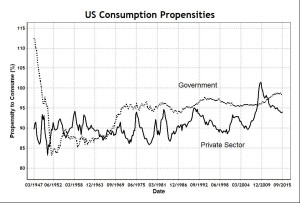
Note that the PC can be greater than 100 percent, because net investment can be negative, even though gross investment cannot be negative. When net investment is negative, it means that gross investment is less than current consumption of fixed capital, meaning that plant and equipment are allowed to depreciate or run down without adequate maintenance through ongoing investment. Negative net investment has occurred in two periods since WW2.
Immediately after WW2, much of the wartime plant and equipment of the government was allowed to be run down, because they were no longer useful for the peacetime economy. The second period of negative net investment occurred in the private sector in the GFC, when there was a strong curtailment of private investment, particularly in the building and construction sector, as many projects were abandoned and written off.
Note that the government PC appears less volatile because government expenditure is devoted almost entirely to consumption, as government PC is almost 100 percent. Another way of explaining the lack of volatility in the government PC can be seen in the chart below: where, above a certain level, say 30 percent of GDP, government expenditure has appeared almost entirely as consumption. That is because government net investment has been static at a low level, typically around one percent of GDP.
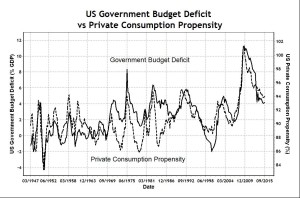
Note also that private sector PC is much more volatile than government PC, because private sector investments fluctuate more emphatically in reaction to government policy and to the conditions of the business cycle. The fifth chart above shows that government budget deficits create a substitution effect where savings are directed from real private investment to financial investment in government securities. The consequence of this substitution effect is an increase in the private consumption propensity due to a fall in private investment, which accompanies government budget deficits. The volatility in private sector PC is therefore driven by the volatility in government budget deficits as seen in the chart below.
Conclusion
Much of the smoothness in personal consumption expenditure (see first chart) has been explained by US government spending on welfare consumption. Government budget deficits have channeled private sector savings away from real investment to financial investment in government debt, increasing the propensity to consume in the private sector through transfer payments. Mathematical details are contained in a research paper.
Decades of budget deficit spending have steadily increased total consumption of the economy, which is now either near the Keynesian singularity or inside the black hole, which is the subject of the next post.