
Most people understand and assume that government income redistribution, where higher incomes are taxed and transferred to those with lower incomes, is a way of achieving greater income equality. But few people are aware of the extent of corporate socialism which is defined here as the transfer of capital, by government to corporations.
In the heat of the GFC, corporate socialism was blatant as there was no need to hide the fact that financial corporations needed to be saved by the government’s injecting trillions of dollars into them to maintain liquidity and solvency of the financial system. The income inequality created by corporate socialism was equally blatant, making billionaires of executives such as Lloyd Blankfein (in July 2015), CEO of Goldman Sachs, a bank which was central to the fraudulent dealings of subprime mortgage derivatives triggering the GFC.
The close connection between the US government and the financial sector through the operations of the US Federal Reserve is perhaps well understood. But less well understood is how corporate socialism has been operating less blatantly by the government over the decades, not just recently. For example, nearly 6 percent of GDP collected annually in indirect taxes comes substantially from import duties, which protect corporations from foreign competition at the expense of consumers. American corporations can charge the consumers more than otherwise for their products – an outcome which would be contrary to advice from neoclassical economics.
But neoclassical economics would recommend government policy to deregulate the labour market to provide more flexible wages and salaries in order to increase employment. Wage flexibility is a euphemism for lower wages, because it is assumed that lower wages enable employers to hire more staff. The downward pressure on wages came from technology, globalization (liberalization of international trade), outsourcing and de-unionization of the private sector workforce, which fell from 35 percent membership to about 6.5 percent over 50 years.
Globalization has led to cheaper products, but also to greater competition for corporate profits. Lower wages enable higher corporate profits, because labour is usually the most significant cost to business operations; higher profits would result if the business captures the benefit of lower wages by not increasing its labour hire. Deregulation of the labour markets started in the UK under Thatcher, and in the US under Reagan, in the early 1980s, with the breaking of labour union strikes. The impact of this government policy took about a decade to be seen in the economic data, as the following chart shows.
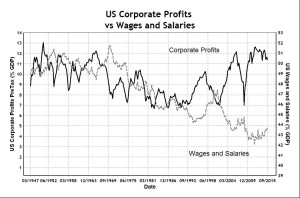
As expected there has been a strong anti-correlation between corporate profits and employee compensation, which is defined by the sum of wages and salaries and employer supplements. Up until the late 1980s, employer supplements rose steadily from 4 percent of GDP to about 10 percent, adversely affecting corporate profits by about 5 percent. But, thereafter in the 1990s employer supplements stabilized and fluctuated around 10 percent of GDP, allowing the fall in wages and salaries to flow directly to corporate profits (see the chart above).
Hence, since the early 1990s, there has been a rising trend of corporate profits by about 5 percent of GDP and a continued falling trend of wages and salaries by about 3 percent of GDP. The development of such disequilibrium trends of falling employee compensation would have been unsustainable for the past 25 years, had it not been for government intervention with social welfare to compensate for falling pay of workers, as the chart shows below.
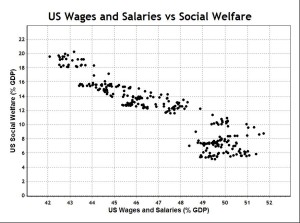
In this chart, the passage of time moves generally from right to left as US wages and salaries fell continually from 52 percent of GDP to 42 percent over the data period. Social welfare payments from government have maintained the growth of personal income, so that the standard of living of Americans has continued to rise, whereas it would otherwise have fallen, as the last chart in the previous post shows. Therefore, the need for government intervention to sustain personal income has its origins in the deregulation of the labour market.
Neoclassical economics assumes that unemployment is voluntary and that involuntary unemployment is caused by government regulation resulting in price rigidity of the labour market. This is a simplistic view. The labour market is not like the markets of everyday goods and services, where the unarticulated assumptions of the free-market may not necessarily be valid for labour contracts because of information asymmetry or unequal power of negotiation in labour exchanges.
The data suggest that wages and salaries were under downward pressure since the Taft-Hartley Act (1947). The neoclassical economics revival of the 1980s provided employers with impetus to exploit further the vulnerability of workers for profit maximization (see the top chart). Industrial strikes, which were largely banned in most situations, may have been the only way for some trade unions to compel employers to negotiate fair contracts. It should be observed that public service unions which serve the non-profit government appeared to have negotiated more favourable wages and salaries.
In summary: the US government policy of allowing falling wages and salaries to be compensated by rising social welfare, to maintain increases in personal income and consumption expenditure, is the back-door to corporate socialism – where corporate profits are boosted by lower wages as a hidden subsidy from government. This leads to a wealth transfer from taxpayers to the rich, who are the majority shareholders of large corporations. This source of wealth inequality is not due to capitalism originating from wealth creation processes of economic production, but from wealth transfer from taxpayers by government intervention. Corporate socialism is a source of the wealth inequality in America.
Income Inequality
The chart below shows the share of the top one percent of US income earners using the data from The World Wealth and Income Database (Alvaredo et al., 2015), compared with pre-tax corporate profits.
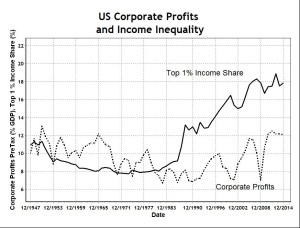
While corporate profits have increased in the past 25 years, but only to post-war levels relative to GDP, income inequality measured by the share accrued to the top one percent has increased dramatically. This suggests that current income inequality is not caused by the level of corporate profits, which are the same as after WW2 when inequality was much lower. This fact, and the fact that capital income has been relatively constant as a percentage of GDP and as a component of personal income, suggests that the income inequality is caused by corporate profits benefiting relatively fewer people. Therefore, the cause is the narrowing of the distribution of corporate profits, rather than greater corporate profits, greater capital income or higher return on capital.
Hollowing of America
It has been shown so far that US government policy can be characterized by welfare for corporations and for low-income households. This welfare policy has been the consequence of allowing the suppression of wages and salaries in the labour market. Stagnant wages and salaries contain costs relative to growing revenue for companies, thus increasing profits and boosting share prices. For low-income households with stagnant wages, real income has been augmented by increasing social welfare and deficit spending by the government.
Since wealth redistribution by government expenditure favours both the low end and the high end of the income spectrum, the middle class effectively shoulders a substantial burden by paying more taxes than it receives in benefits. This policy limits the economic viability of parts of the middle class and is responsible for the hollowing of America. The middle class – consisting of small and medium enterprises of entrepreneurs, professionals and family businesses – is the major employer and the real engine of economic growth under capitalism.
A study of the Pew Research Centre (Kochhar et al., 2015; DeSilver, 2015) examines the changing size, demographic composition and economic fortunes of the American middle class. The “middle-income” Americans are defined as adults whose annual household income is two-thirds to double the national median. That is an income range of about $42,000 to $126,000 annually in 2014 dollars for a household of three. Under this definition, the middle class made up 50% of the U.S. adult population in 2015, down from 61% in 1971.
This definition of middle class understates the situation: would a household of three earning an annual income of $43,000 be considered middle class? Would a household of three earning an annual income of $127,000 be considered upper class? This definition substantially understates the size of the lower class in America, as a household of three on an annual income of $42,000 would have already received substantial social welfare payments (even food stamps). Such households should be classified as poor.
Even though this definition of the American poor is rich by world standards, where median household income is less than $10,000, it merely reflects the fact that most of the world lives in abject poverty – there is a serious global economic challenge. On this reckoning of the American poor, Pew Research data would suggest a 2.3 percent increase in poverty in America from 1971 to 2015. But this statistic understates the migration to the lower class.
Any definition based on a statistical average such as the median is flawed, because effectively it “moves the goal posts” and eliminates useful economic information. For example, households below the average income are by definition 50 percent of all households, providing no useful economic information about their absolute wealth or income adequacy. For example, even households of three on a median income of $63,500 would have already included significant social assistance, indicating dependency (see charts in the previous post).
On Pew Research definition, the upper class increased by 9 percent over the 44 years creating a misleading, but positive, impression that the middle class has been migrating to the upper class. A more appropriate definition of the income classes should see much smaller migration to the upper class (see the last chart) and a much larger migration to the lower class. The main reason for this belief is that the large and rising social welfare spending is caused by the need for government assistance to supplement otherwise inadequate personal incomes.
Welfare Trap
The rules of social welfare have also contributed to a disincentive for some of the lower class to work and earn higher wages. For example, Alexander (2012) of the Department of Public Welfare has described the concept of a “welfare cliff”, where a higher wage could cause various welfare benefits to drop off to such an extent that the worker is worse off with a lower overall income. A single mother earning a pre-tax wage of $29,000 has a net income of $57,327 after tax and welfare benefits. She would be better off than earning a pre-tax wage of $69,000 with a net income of $57,045 after tax and welfare benefits. The welfare structure creates a growing lower class which is so dependent on government redistribution that it must remain politically docile and compliant.
The middle class, referred to derisively as the petite bourgeoisie by Marxists, consists of sole traders, entrepreneurs, impresarios, professionals, shop keepers, family businesses, etc. It is from this class that most of the inventions and innovations originate to drive new economic growth. For example, Apple Computer, which has been the largest company in America (and the world) by capitalization, started famously in a suburban garage in 1975. Most technology start-ups, in hardware and software, in communication, social media, etc. develop their initial ideas in small businesses, which are often later bought by larger firms. Large firms are mostly distributors, sales and marketers, profit extractors, cost minimizers or intermediaries rather than true innovators, and often not even producers (e.g. retail giants such as Walmart).
Using US Census Bureau data, Gallup (Clifton, 2015) reported that the birth rate of new businesses or start-ups with at least one employee has been halved since 1977 from more than 16 percent to just over 8 percent in 2012. The death rate of businesses has fluctuated between 8 and 10 percent over the same period. Since 2008 when the birth rate and the death rate crossed over at around 9.5 percent, the death rate has exceeded the birth rate, resulting in a net closure of 70,000 businesses as the dynamo of capitalism continued to falter.
Faltering Capitalism
When wealth distribution, through government and the financial services sectors, becomes more economically rewarding than wealth creation through invention, production and manufacturing, then the incentive is to distribute wealth, rather than create it. Of the richest persons in America (Forbes, 2015), about 30 of the top 100 are from the financial services sector – mainly in hedge funds, investments, real estate, money management and stockbroking. the chart below shows the transformation of the US economy as measured through value added by industry (BEA data).
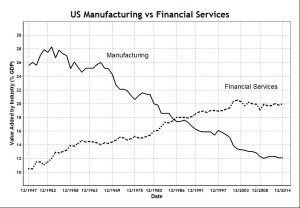
This is the “skull and crossbones” chart of the American economy, where the missing skull is the middle class. Employment opportunities in manufacturing are much more numerous than in the financial services sector, which includes finance, insurance, real-estate, rental and leasing, and is often referred to as the FIRE sector. Manufacturing such as the auto-industry often involves large numbers of small businesses making parts, while financial services rely mainly on technology and scale to extract profits from transactions – these days increasingly done automatically by computers with high frequency trading algorithms.
In principle, the financial services sector, according to Lloyd Blankfein, CEO of Goldman Sachs, deserves enormous rewards because it is “doing God’s work”. He probably meant that Goldman Sachs traders are part of the “invisible hand” making the financial markets efficient, taught as the “efficient market hypothesis” (EMH) in university. But the creators of EMH are quick to point out that they do not mean “economic efficiency”, but only “informational efficiency” – an unscientific idea which cannot be clearly defined or proved. But it is enough to confuse and mislead Lloyd Blankfein and the world.
A superficially plausible textbook justification may be that the financial services sector adds economic value by allocating resources through raising capital selectively for sound businesses, by arranging the issuance of company shares and by extending loans. But facts do not support this rationalization, particularly in the lead up to the global financial crisis, when many banks, including Goldman Sachs, were involved in making bad loans, profiting from it and enriching themselves through the processes of securitization, origination and distribution. And when they failed and suffered losses, the US government extended generous corporate welfare by transferring trillions of dollars to their balance sheets – a blatant example of corporate socialism.
Conclusion
This concludes the third part of a research paper which, in a scientific approach, is concerned primarily with facts, not theories. But one of the facts is: economic theories have influenced economic policy which has led to identifiable and observable outcomes for the US economy. Generally, economists have been unable to recognize many important facts due to cognitive dissonance caused by the need to defend their own economic schools, placing theories ahead of facts.
From a theoretically neutral perspective, free from allegiance to any school, the paper has inferred from the empirical data the following important provisional facts:
- Neoclassical, monetarist and Keynesian economics have all played their parts in a policy pluralism based on inconsistent theories which explain the development of the US economy since WW2.
- The rise in personal income, despite falling share in wages and salaries, has been engineered with social welfare financed through increased government borrowing from domestic and foreign savings, which have then been consumed in a creeping socialism.
- Rising personal consumption expenditure, financed from deficit spending, has led to falling net domestic investment, which explains the fiscal impotency of promoting economic growth.
- Rising wealth inequality has resulted from falling share of wages and salaries, due to labour market deregulation, which has been a de facto subsidy to company profits in a form of corporate socialism.
- A hollowing of America with a shrinking middle class which pays most of the taxes, has led to faltering entrepreneurial capitalism.
- A large and growing lower class, dependent on government social welfare, leads to a docile and compliant population, unable to exercise its democratic rights – the result of a bread and circuses political strategy.
The paper has not succumbed to mainstream preoccupation with inflation, interest rates, money, asset prices and monetary policy because those are not the primary issues of importance to the economy. Money and debt are important instruments for implementing government economic policy. With a fiat money system (since 1971), almost any policy can be maintained indefinitely so long as confidence in the system is maintained.
Ultimately, confidence depends on the performance of the real economy which is the main focus of this paper, because the power of money to influence the economy, for better or worse, is manifested eventually in actual economic results – and the results have not been pretty. Essentially, fiat money has allowed bad government policies to be pursued without discipline or accountability for much longer than otherwise. In this sense, money is not neutral in the long-term – active monetary policy may cause economic harm (Sy, 2015b).
Because mainstream economic knowledge is unscientific, incoherent and flawed, the US government has no rational basis, evident from its failed performance, to manipulate fiscal or monetary policy to improve the economy. The result of accumulated policy errors has been a gradual but continuous secular decline and rising inequality. Ivory tower academics, particularly Marxists, are still looking to blame capitalism.
Countries such as China, where the government has been intervening more boldly and more extremely, would be expected to decline more rapidly and result in greater inequality simply because unproven measures employed have a high probability of error and failure. Extreme government intervention such as the central planning of the former Soviet Union or Maoist China has proved to be extreme economic failures, with serious inequality and economic collapse.
The paper shows that the main objective of macroeconomics should be to trace the economic consequences, intended or otherwise, of deliberate government policy and actions connecting economic theories, policy actions and consequences. Economic and policy pluralism has resulted in a cognitive dissonance – preventing recognition of the important task of matching deliberative government policy and actions to their factual consequences. In performing this task in this paper, economics has taken one of the rare first steps towards a true social science. We have uncovered a neglected, but important, objective of a scientific economic paradigm.
A very interesting piece.
Last year, the theme of corporate welfare created quite a stir in the UK press, e.g. http://www.theguardian.com/politics/2015/jul/07/corporate-welfare-a-93bn-handshake
Kevin Farnsworth of York University, UK, has spent quite a few years studying this in the UK context. See, for example:
http://speri.dept.shef.ac.uk/wp-content/uploads/2015/07/SPERI-Paper-24-The-British-Corporate-Welfare-State.pdf