
The previous post discussed the influence of pluralism in economic policy. As an historical summary of the cognitive dissonance, it suffices to observe the policy circus: the free-market capitalism in the early twentieth century was blamed for the Great Depression; it gave way to Keynesian socialism after the Second World War (WW2) then back to deregulated market capitalism and monetarism since the stagflation of 1970s; and more recently back to renewed Keynesian government intervention since the global financial crisis (GFC) which started in 2008. With each circuit of theoretical favoritism, the structure of the US economy evolved with mutating blends of policy pluralism, but generally with increasing socialism.
Many still cling to the image of the entrepreneurial spirit of American capitalism, to which they have rightly attributed their historical prosperity. But, over the decades the size of the US government measured by total government expenditure as a percentage of GDP has been continually increasing, as is seen the chart of the previous post. The size of government has increased from 20 percent of GDP to over 36 percent of GDP in 70 years. This fact of gradual increase in the size of government is called here creeping socialism, which has occurred also in other Western countries.
In a cross-sectional study of 40 countries over a recent 10-year period, it was shown empirically that, on average, increasing socialism leads to decreasing economic growth (Sy, 2015c). This observation holds true longitudinally also for the US economy in the years since the WW2, as the following chart shows.
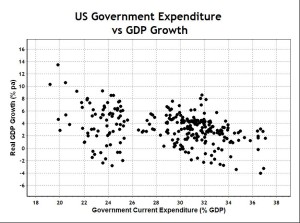
Each point in this chart represents a quarterly measurement of real GDP growth and the size of government (as expenditure normalized to GDP). Creeping socialism refers to the gradual increase, over a period of nearly 70 years, in the size of government from under 20 percent after WW2 to over 36 percent soon after the start of the GFC. In the above chart, earlier data points are to the left and later data points are to the right, with the break into two groups of points occurring in the late 1960s, probably due to a permanent rise in the “military industrial complex” cautioned by President Eisenhower in his 1961 farewell speech.
Economic growth in the short-term is volatile due to inherent complexity of the production processes. Even so, the impact of increasing size of government on economic growth is still evident statistically, with an anti-correlation of -0.36 and an R-square of 0.13. But over a longer-term, influence from persistent factors emerges more clearly over the random noise of short-term data. Taking discrete two-year averages reduces the dataset to 34 data points, the anti-correlation increases to -0.5 and the R-square increases to 0.25.
This evidence is significant because the size of government, as an economic variable, has little direct impact on economic production. The question is: why is larger government detrimental to economic growth? The standard textbook explanation of “crowding out” (e.g. Mankiw, 2009, pp.791-792) is confusing and incorrect, as will be discussed below. Clearly, there is no apparent, a priori, universal reason why this should be the case. But a case study of the US can be made by examining how and why the US government has been continually increasing its current expenditure.
Government current expenditure consists of consumption expenditure (both defence and non defence), current transfer payments (social benefits, Medicare, etc.), interest payments and subsidies. Government current receipts consist of tax receipts (personal, corporate, production and imports), contributions to social insurance, income from assets and current transfer receipts (from persons and business).
The chart in the previous post shows that US government current expenditure increased from about 20 percent of GDP to about 34 percent of GDP, representing a 14 percent of GDP increase over the data period. Most of this 14 percent increase is due to about 11 percent of GDP increase in government current transfer payments (BEA, Table 3.1), as the chart shows below.
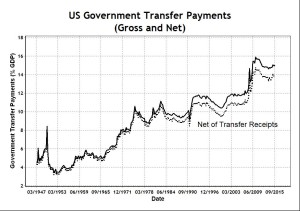
Transfer payments include benefits to individuals for retirement & disability insurance, Medicare and Medicaid, income maintenance, unemployment, veterans, education and training, student assistance, disaster relief, food stamps, and so on. There are also payments to businesses and non-profit organizations for payments to individuals.
Compare transfer payments with actual government expenditure in consumption and investment which has fallen from a post-war high of about 25 percent of GDP to 18 percent in 2015, now comprising of about four percent defence, three percent federal government expenditure and 11 percent of state and local government expenditure. Transfer payments at 15 percent of GDP in 2015 are trending upwards, while other expenditures at 18 percent are trending downwards.
The increase in transfer payments has not been funded adequately from increases in transfer receipts, so that transfer payments net of transfer receipts increased by about 10 percent of GDP over the data period, as the chart shows below.
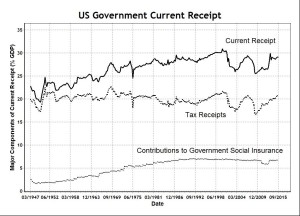
The major components of government current receipts are current tax receipts and contributions to government social insurance. Government current tax receipts have remained relatively steady at about 20 percent of GDP, while an increase in contributions to government social insurance from 2 percent of GDP to about 7 percent of GDP accounts for most of the increase in government current receipts of about 7 percent of GDP. The contributions to government social insurance have remained relatively static since the 1980s, not keeping pace with increases in government transfer payments.
In summary, the cause of growing US government budget deficits is not primarily due to increases in government consumption, as is often assumed, but is due principally to growing unfunded transfer payments in social security, Medicare, Medicaid, unemployment and other social welfare payments. Wealth transfer through social welfare payments is the hallmark of socialism. Clearly, this policy does not represent American capitalism as it is commonly understood nor is it neoliberalism of neoclassical economics – it is socialism.
Socialist Income Redistribution
Socialism is a system where the government takes from those who produce to give to those who do not, in a process of income redistribution. Government current expenditure consists mainly of government consumption and investment (defence and non defence), and social welfare payments. Government current receipts come mainly from taxation, as seen in the above chart.
Government tax receipts consist mainly of three components: personal income, corporate income and indirect taxes which are production taxes and import taxes, as seen in the following chart (BEA, Table 3.1).
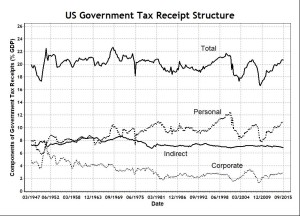
Personal income taxes rose from about 7 percent of GDP after WW2 to about 11 percent currently, with most of the rise taking place before 1970. Indirect taxes remained nearly constant over the period, falling slightly by about 1 percent to about 7 percent of GDP currently. Corporate tax contributions to government tax receipts fell from about 5 percent to about 3 percent of GDP, a relatively large decline. Hence more and more of the tax burden fell on personal income earners who now contribute more than 50 percent of all government tax receipts, while corporate income contributes only about 10 percent of government tax revenue, or 3 percent of GDP; globalization has provided opportunities for corporations to minimize tax through techniques such as transfer pricing.
Business and academic economists alike often focus only on “falling” wages and salaries as an indication of the plight of workers in America, without considering the complex personal income structure created by government transfers. Certainly, wages and salaries have fallen in relative terms as a proportion of GDP, but they have been replaced by other sources of income. Even on a real per capita basis, wages and salaries have not fallen, but have only stagnated in the past 15 years, as the chart below shows (BEA, Table 2.1).
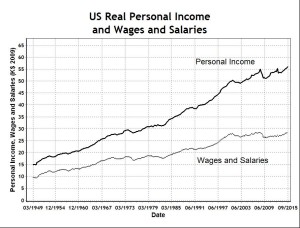
In real terms (2009 dollars), wages and salaries account for only about half of personal income. Real personal income per capita (in 2009 dollars) has continued to rise from $15,000 in 1949 to $55,000 currently, albeit rising more slowly in the last decade. But real wages and salaries per capita have risen more slowly. The sources of non-wages and salaries growth in personal income are shown in the following chart (BEA, Table 2.1).
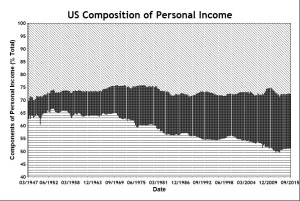
The top band of personal income represents what we call “Capital Income”, which consists, in official data, of proprietors’ income, rental income and asset income. Proprietors’ income is non-farm income from unincorporated businesses, such as sole traders, partnerships, cooperatives, credit unions, mutual companies and so on. Rental income refers to the income of landlords owning residential or commercial property. Asset income refers to income from ownership of assets apart from property, such as fixed income from debt securities, dividends from shares, etc. Capital income has remained relatively constant at just under 30 percent of personal income.
The bottom band of personal income is wages and salaries, which have declined from about 65 percent of personal income to about 52 percent in recent years. This decline has been compensated by social welfare. The middle band of personal income represents social welfare, which we have defined as the sum of net transfers from government and employer supplements. The US government provides social welfare to boost personal income in two main ways: first, through direct government transfer payments (social security, medical and unemployment benefits, etc.) and, second, by mandating employers to contribute to employees’ pension and insurance funds.
The main components of personal income can be summarized by the equation:
Personal Income = Wages and Salaries + Employer Supplements + Net Transfer Payments + Capital Income
The sum of the first two terms on the right hand side is called “Employee Compensation” in official data. For convenience, we call the sum of the second and third terms “social welfare”, because of the welfare nature of employer supplements in addition to government transfers. Net transfer payments refer to government transfer payments less contributions to government social insurance. Since the people receiving government payments are mostly different from those making contributions to social insurance, the net transfer payments include a large amount of income redistribution by the government within the personal income sector.
In passing, it should be noted that the above chart suggests, and other calculations verify, that capital income relative to GDP is relatively stable over nearly 70 years, fluctuating randomly between 25 and 30 percent of GDP. That is, the rate of return on capital , however capital is defined and measured, is at approximately the same rate as economic growth as measured by GDP. This observation is a simple falsification of the Piketty hypothesis (2014) that increasing income inequality in America and other “capitalist” countries is due to capital return r being greater than the rate of economic growth g, expressed as the (r > g) “Piketty law”, which is a “law” about “return on capital”.
An alternative explanation is not based on “return on capital”; rather based on the distribution of the return on capital – fewer people are sharing more of the benefit of the same capital pie, which has an approximately constant growth relative to the size of the US economy according to the current measure (i.e. r=g approximately). This alternative explanation of how fewer people benefit from capital ownership is based on the observed effects of government policy of wealth transfer, which will be discussed further in the next post.
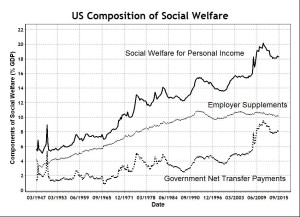
The chart below shows that social welfare is nearly 20 percent of GDP, which is mandated directly (transfer payments) or indirectly (employer supplements), by government. Direct transfer payments account for 45 percent of government total current expenditure, over half or 24 percent of which expenditure directly boosts personal income. They have increased substantially since the GFC with various fiscal stimulus packages and there have been recent calls for even more transfer payments to stimulate the stagnant US economy.
Socialist Consumption
It is a widely held belief, and is taught at university, that consumption leads to prosperity. This may be the reason why social welfare rose from 6 percent to over 18 percent of GDP in the past 70 years – a deliberate government policy to increase personal consumption expenditure, in order to increase the marginal propensity to consume.
Monetary policy of the US Federal Reserve is directed at encouraging consumer spending, as its chair, Yellen (2014), said in an interview:
Our policy is aimed at holding down long-term interest rates, which supports the recovery by encouraging spending. And part of the [economic stimulus] comes through higher house and stock prices, which causes people with homes and stocks to spend more which causes jobs to be created throughout the economy and income to go up throughout the economy.
As well as the “wealth effect” induced by monetary stimulus which supposedly causes greater consumption, there is also a permanent fiscal stimulus to greater consumption through social welfare.
It is assumed that lower income earners have higher propensities to consume their income and, therefore, social welfare increases total consumption in the economy. Government economic policy has been based on Keynesian economics, which believes that economic growth is driven by aggregate demand which can be increased through the Keynesian multiplier. Since social welfare spending increases consumption, it would therefore be an effective way of increasing the propensity to consume and thus increasing the Keynesian multiplier, which is assumed to increase economic growth (Sy, 2014a).
The chart below provides a maximum estimate of how much social welfare would have boosted personal consumption expenditure by subtracting successively from it net government transfers and then employer supplement. That is, personal consumption expenditure could have been as much as 18 percent of GDP lower than it actually is, were it not for the government having boosted private consumption.
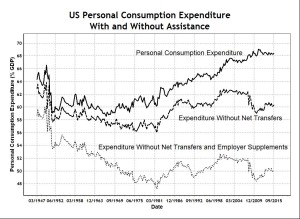
It is clear that most of the government transfer payments would be spent in consumption by their recipients, who are mostly lower income earners. But, since employer supplements are not paid directly to employees but are paid mostly into pension and insurance funds, it is less clear that these payments would add immediately to any increase in the ability of workers to spend.
But the ability to spend otherwise inaccessible funds is what financial innovation and financialization have provided. Once workers see employer supplements as government mandated saving which they would not otherwise have voluntarily undertaken, they would seek to borrow against the funds in financial arrangements generally called “equity release”. Easy monetary policy, directly or indirectly, encourages workers to spend their equity or their saving, which earns less and less due to Keynesian policy of “euthanasia of the rentier”.
The whole idea of saving for retirement contradicts the Keynesian attitude which sees saving as undesirable, being a form of rent seeking. Keynes (1936, p.376) saw that postponing consumption now through savings to increase consumption in future is one of the evils of capitalism, which he called an exploitation of the scarcity of capital, saying:
…yet it would mean the euthanasia of the rentier, and consequently, the euthanasia of the cumulative oppressive power of the capitalist to exploit the scarcity-value of capital…
… I am advocating, that the euthanasia of the rentier, of the functionless investor, will be nothing sudden, merely a gradual but prolonged continuance of what we have seen recently in Great Britain, and will need no revolution.
What Keynes was saying was that, to “kill off” savings by making savings worthless through inflation or through other means, is to devalue financial investments. This Keynesian view of savings is inconsistent with government propaganda to encourage workers to save for their retirement – another clear example of cognitive dissonance. The 10 percent of GDP increase in government net transfer payments have been “funded” from savings through debt in two ways. About 6 percent of GDP comes from contribution to government social insurance, mainly through employer supplements in employee compensation. The other four percent of GDP comes from borrowing through Treasury bonds which are held by domestic savers through mostly pension funds, and by international savers through foreign central banks.
The idea taught in university macroeconomics that saving equals investment is empirically a fallacy, as has been shown here and discussed elsewhere (Sy, 2014b). In brief, American saving has been borrowed by the government and spent on social welfare to increase consumption. The fact that increased consumption has not resulted in increased economic growth, due to the Keynesian fallacy, means that American saving is at risk in the sense that, in future, the US government may not fully fulfill, i.e. default on, its promises to its savers and pensioners.
In summary, America has become steadily more socialist with a government current expenditure of 36 percent of GDP where over 40 percent of this expenditure is devoted to income redistribution. It is surprising that this redistribution has led, as often observed, to greater income inequality, not less. Corporate socialism and a hollowing of America may be the explanation, as will be shown in the next post which forms the third part of a research paper.